Below are selected presentations I have given. Where available, links to video of the presentation are provided. To download the presentation, you can click on the link below the title. For attribution or citation look either at figshare, or send me an e-mail.
Do Good Data 2016, Chicago, IL, April 28th 2016
Building a Large Scale Machine Learning Application in Government
Guest Lecture at University of Houston Clear Lake, Clear Lake, TX, April 15th, 2016
Houston Education Research Consortium Workshop, Houston, TX, April 14th, 2016
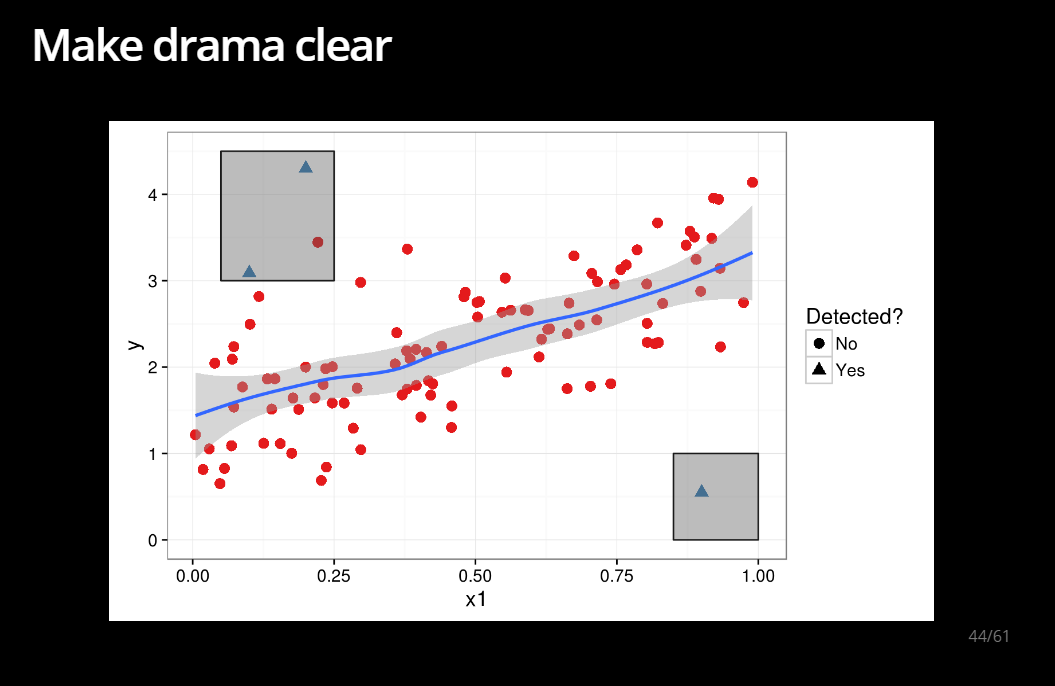
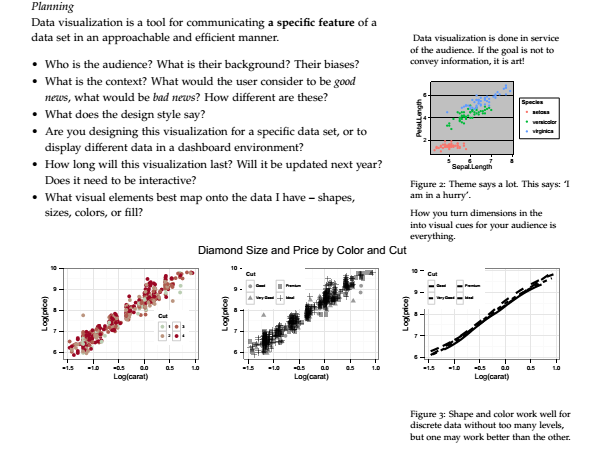
Bringing Evidence and Argument: An Intro to Data Visualization
State of Wisconsin Equity Plan Training, Madison, WI, February 12th, 2016
Data Behind the Equity Plan [YouTube]
STATS-DC 2015, Washington D.C., July 8th, 2015
Two Sides of the Same Coin: State Staff and Researcher Perspectives on State Longitudinal Data
Dissertation Defense, Madison, WI, May 13th, 2015
Strategic Data Project Institute for Leadership in Analytics, Boston, MA, March 5th, 2015
Data Visualization for Education Policy Decision Making and [handout]
State of Wisconsin Data Analyst Workshop, Madison, WI, October 17th, 2014
Beyond the Bar Graph [webcast with audio and video]
STATS-DC 2014, Washington D.C., July 31st, 2014
An Early Warning System for You: Wisconsin’s Open Source Predictive Analytic Approach
Wisconsin Promoting Excellence for All Taskforce, Madison, WI, April 9th, 2014
Strategic Data Project Institute for Leadership in Analytics, Boston, MA, February 14th, 2014
Guest Lecture at the Interdisciplinary Training Seminar in Education Sciences at the Wisconsin Center for Education Research, Madison, WI January 31, 2014
Statistical Learning and Applied Modeling in Education: Examples and Concerns
Guest Lecture to UW-Madison La Follette School of Public Affairs, Madison, WI Fall 2013
Using Statistical Models to Help Policymakers Avoid Mistakes
Guest Lecture to UW-Madison La Follette School of Public Affairs Program Evaluation Course, Fall 2012 & 2013
Perspectives on Working in Government
STATS-DC Conference 2013, Washington DC, July 17th 2013
Building and Deploying an Early Warning System: Lessons Learned from a Large Scale Pilot
NCES MIS Conference 2013, Washington, DC, February 13th, 2013
Strategic Data Project Fellows Workshop, Denver, CO, January 17th, 2013
Summer Institute for Leadership in Analytics, The Strategic Data Project at Harvard University, August 5th 2012
Strategies and Structures for Improving Data Use - An SEA Perspective
STATS-DC Conference 2012, Washington DC, July 11th 2012
Using R and Longitudinal Data System Records to Answer Policy Questions
UseR! 2012 Conference Lightning Talk, Nashville TN, June 13th 2012
Wisconsin ELL Stakeholder Meeting, Madison, WI June 3rd 2012
NCES MIS Conference 2012, San Diego, CA February 15th 2012
Wisconsin Education Accountability Taskforce, Madison, WI September 22nd 2011
Using Data to Identify Priorities in an Accountability System

